
Understanding Technical Analysis Fundamentals

Technical analysis is a powerful tool that investors and traders utilize to forecast future price movements based on historical data. It focuses on price patterns and trading volumes to inform decision-making. By examining charts and various indicators, traders can identify trends and potential entry and exit points, making it essential for anyone looking to navigate the complex world of financial markets.
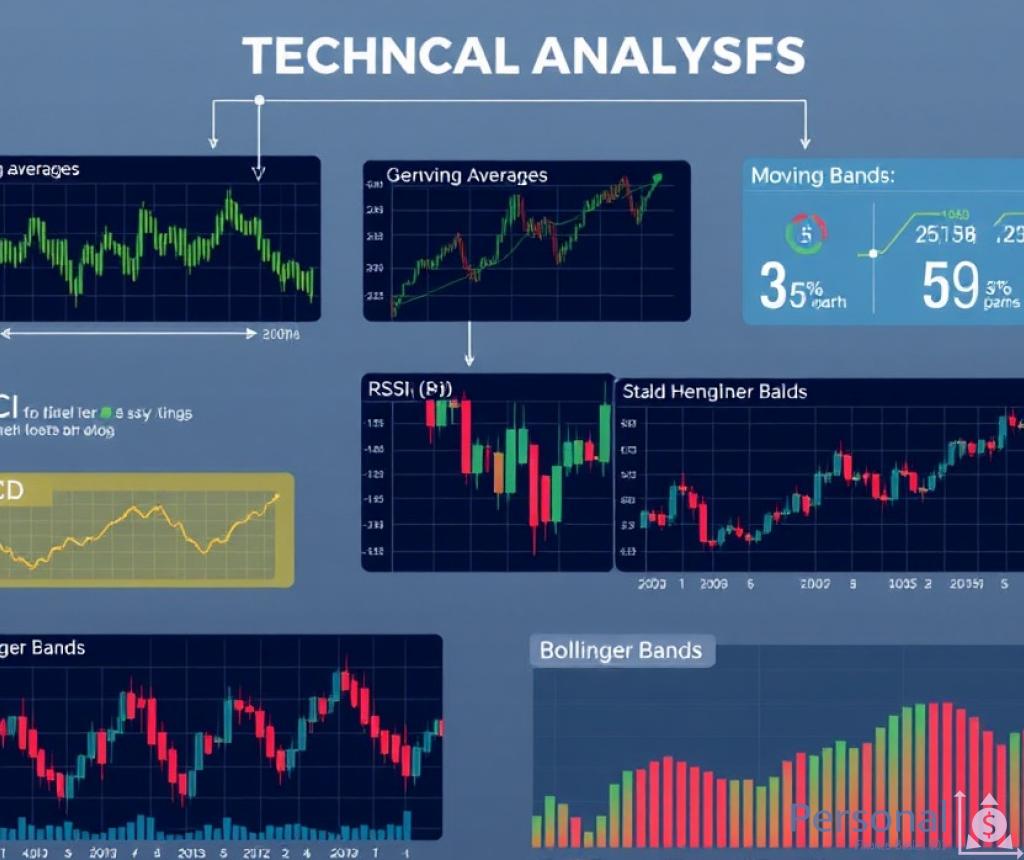
Understanding the core components of technical analysis is crucial for beginners. Traders rely on various elements to interpret market behavior effectively. Below is a brief overview of the primary components:
- Charts: The visual representation of price movements over time, including line charts, bar charts, and candlestick charts.
- Indicators: Mathematical calculations based on price and/or volume that help traders identify trends and potential reversals, such as Moving Averages and Relative Strength Index (RSI).
- Volume Analysis: An assessment of trading volume to gauge market strength and identify potential reversals or confirmations of trends.
Chart patterns are formations created by the price movements of a security over time. Recognizing these patterns can provide insights into market sentiment and potential future movements. Here are some common chart patterns that every trader should be aware of:
| Pattern Name | Description | Implication |
|---|---|---|
| Head and Shoulders | A reversal pattern that signals a change in trend direction. | Bearish Reversal |
| Double Top | A bearish reversal pattern that occurs after an uptrend. | Bearish Reversal |
| Ascending Triangle | A bullish continuation pattern indicating potential upward breakout. | Bullish Continuation |
| Flags and Pennants | Short-term continuation patterns that indicate a brief pause before the previous trend resumes. | Continuation of Trend |
By mastering these fundamental aspects of technical analysis, beginners can build a solid foundation for making informed trading decisions. As the market is ever-evolving, continuous learning and adaptation are key to success.
Key Indicators and Their Applications
The world of technical analysis is replete with various indicators that serve as invaluable tools for traders. These indicators help in deciphering market movements and making informed decisions. Understanding their applications allows traders to gauge market sentiment, predict future price movements, and ultimately refine their trading strategies. Below, we explore some of the key indicators that every beginner should become acquainted with.
One of the most widely used indicators, moving averages help traders identify the direction of the trend by smoothing out price data over a specific period. By calculating the average price over a set number of days, traders can gain insights into short-term and long-term trends. There are two main types of moving averages:
- Simple Moving Average (SMA): This indicator averages the closing prices over a specified period, providing a clear view of the trend direction.
- Exponential Moving Average (EMA): This variant gives more weight to recent prices, making it more responsive to new information, which can be particularly useful during volatile market conditions.
The Relative Strength Index (RSI) is a momentum oscillator that measures the speed and change of price movements. It ranges from 0 to 100 and is typically used to identify overbought or oversold conditions in a market. When the RSI crosses above 70, it signals that the asset may be overbought, while a reading below 30 indicates that it may be oversold. This capability makes RSI a vital tool for traders looking to time their entry and exit points effectively.
Volume analysis is crucial in technical analysis as it provides insight into the strength or weakness of a price trend. High volume during a price increase indicates strong buying interest, whereas high volume during a price decline suggests strong selling interest. Traders often look for volume spikes to confirm trends or signal potential reversals. Understanding volume in conjunction with price movements can enhance a trader’s ability to make sound decisions.
In summary, the key indicators discussed above are foundational tools in the arsenal of any trader. By mastering these indicators and their applications, beginners can significantly improve their chances of success in the financial markets.
Chart Patterns: A Visual Guide
In the realm of technical analysis, chart patterns serve as vital signposts, guiding traders through the intricate landscape of market movements. These formations, derived from price data over time, act as visual representations of trader psychology and market sentiment. Understanding these patterns can significantly enhance a trader’s ability to anticipate future price shifts and make informed decisions.
Chart patterns can be broadly categorized into two types: continuation patterns and reversal patterns. Continuation patterns suggest that the prevailing trend is likely to persist, while reversal patterns indicate a potential change in trend direction. By mastering these formations, traders can better position themselves to capitalize on market opportunities.
Continuation patterns signal that the existing trend is expected to continue after a brief consolidation or pause. One of the most recognizable continuation patterns is the flag. Flags typically emerge after a strong price move, characterized by a slight retracement followed by a breakout in the direction of the original trend. This pattern not only reflects the market’s temporary hesitation but also indicates the strength of the prevailing trend.
Another key continuation pattern is the pennant. Similar to flags, pennants form after a significant price movement but appear more symmetrical, resembling a small triangle. The convergence of the pattern indicates increasing indecision among traders, ultimately leading to a breakout. Recognizing these patterns can empower traders to enter positions at strategic points, optimizing their risk-reward ratios.
Reversal patterns are crucial for traders looking to capitalize on potential trend changes. The head and shoulders pattern is one of the most reliable reversal indicators. This formation consists of three peaks: a higher peak (the head) flanked by two lower peaks (the shoulders). When the price breaks below the neckline formed by connecting the lows of the shoulders, it signals a bearish reversal, prompting traders to consider short positions.
Conversely, the double top pattern occurs after an uptrend and signifies a potential reversal to the downside. This pattern features two peaks at roughly the same price level, followed by a decline below the support level established between the peaks. Recognizing such formations can provide traders with critical insights into market dynamics, allowing for timely decision-making.
For traders, a visual guide to these chart patterns can be invaluable. Below is a comparative table highlighting key characteristics of selected continuation and reversal patterns:
| Pattern Type | Pattern Name | Market Implication |
|---|---|---|
| Continuation | Flag | Trend is likely to continue post-consolidation. |
| Continuation | Pennant | Indicates a pause before the trend resumes. |
| Reversal | Head and Shoulders | Signals a potential bearish reversal. |
| Reversal | Double Top | Indicates a likely change from bullish to bearish. |
Incorporating these chart patterns into trading strategies can provide a clearer understanding of market behavior. By recognizing the implications of various formations, traders can enhance their decision-making process, ultimately leading to more successful trades.
Risk Management Strategies in Trading
In the realm of trading, understanding how to manage risk effectively is paramount. Regardless of one’s experience level, the ability to protect capital while seeking profit is essential for long-term success. Risk management strategies serve as a safety net, allowing traders to navigate the unpredictable waters of financial markets with confidence. By implementing these strategies, traders can minimize potential losses and optimize their overall trading performance.
Traders can adopt various techniques to safeguard their investments and ensure they remain within their risk tolerance levels. Here is a list of fundamental risk management strategies that every trader should consider:
- Position Sizing: Determining the size of each trade relative to total capital is crucial. This helps in controlling risk exposure. A common rule is to risk only a small percentage of the total capital on any single trade.
- Stop-Loss Orders: Implementing stop-loss orders enables traders to set predefined exit points to limit potential losses. This automated approach helps in avoiding emotional decision-making during volatile market conditions.
- Diversification: Spreading investments across different assets or markets can mitigate risks associated with any single investment. Diversification reduces the impact of adverse price movements on the overall portfolio.
- Risk-Reward Ratio: Establishing a favorable risk-reward ratio before entering a trade ensures that potential rewards outweigh the risks. A commonly accepted ratio is 1:3, meaning for every dollar risked, the potential reward should be three dollars.
To effectively manage risk, traders should utilize various metrics and tools. Below is a table illustrating key risk metrics that can aid in evaluating trading strategies:
| Risk Metric | Description |
|---|---|
| Value at Risk (VaR) | A statistical technique used to measure the potential loss in value of a portfolio over a defined period for a given confidence interval. |
| Maximum Drawdown | The maximum observed loss from a peak to a trough of a portfolio, indicating the worst-case scenario over a specified period. |
| Sharpe Ratio | A measure of risk-adjusted return, indicating how much excess return is received for the extra volatility endured by holding a riskier asset. |
By understanding and implementing robust risk management strategies, traders can enhance their resilience in the face of market fluctuations. The adoption of these principles not only protects capital but also fosters a disciplined approach to trading, paving the way for sustained success in the financial markets.
Developing a Personal Trading Strategy
Creating a personal trading strategy is a crucial step for any trader looking to succeed in the complex landscape of financial markets. A well-defined strategy not only provides a clear roadmap but also helps in maintaining discipline and consistency in trading decisions. By incorporating technical analysis fundamentals, traders can tailor their approach to fit their unique risk tolerance, market outlook, and personal preferences.
Before diving into the specific components of your trading strategy, it’s essential to establish a foundation based on your trading goals and style. Are you aiming for short-term profits through day trading, or are you more inclined towards long-term investments? This clarity will guide you in selecting the appropriate techniques and tools for your strategy.
Developing an effective trading strategy involves several crucial elements. Below is a list that outlines these components, enabling you to create a comprehensive approach tailored to your trading objectives:
- Market Research: Continuously analyze market trends and news that may impact price movements. This helps in making informed decisions.
- Technical Indicators: Select relevant indicators, such as Moving Averages and RSI, that align with your trading style to identify entry and exit points.
- Risk Management: Implement strategies like stop-loss orders and position sizing to protect your capital from unforeseen market fluctuations.
- Backtesting: Test your strategy against historical data to evaluate its effectiveness and make necessary adjustments.
- Journaling: Maintain a trading journal to track your trades, strategies, and emotional responses, which can provide insights for future improvements.
As markets are dynamic, it’s vital to remain adaptable. Regularly review and refine your trading strategy based on performance metrics and changing market conditions. This iterative process ensures that your strategy remains relevant and effective, increasing your chances of achieving your trading goals. By embracing a mindset of continuous improvement, you can navigate the financial markets with greater confidence and skill.
Disclaimer
This article has been created or edited with the support of artificial intelligence and is for informational purposes only. The information provided should not be considered investment advice. Please seek the support of a professional advisor before making any investment decisions.